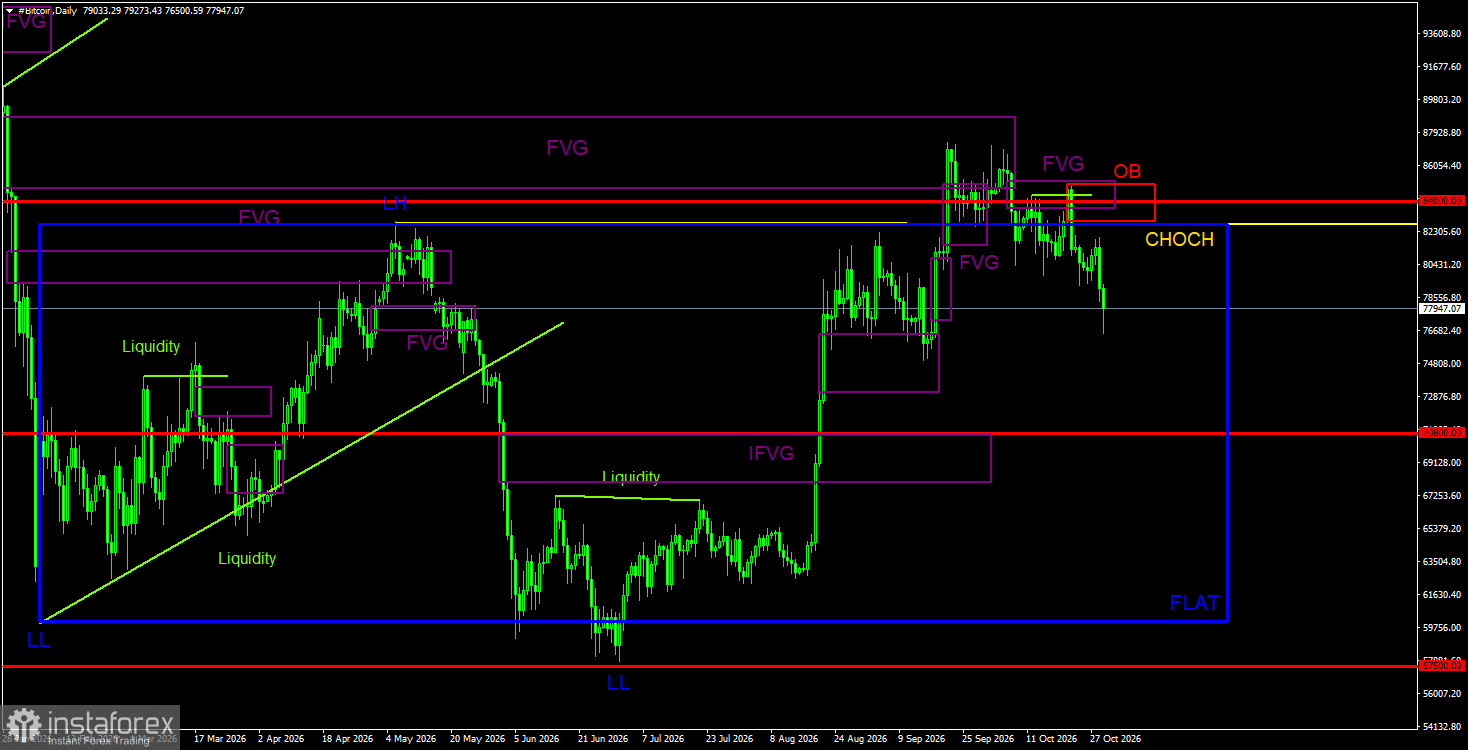
Bitcoin continues a fairly modest decline that could develop into a full-blown crash. For now, the move still looks corrective, but Bitcoin is steadily sliding lower. Recall there is a non-negligible chance the downtrend has already ended. However, the reasons for a new "bull" trend remain ambiguous and debatable. The most recent three-month rise was essentially a move from the lower boundary of the daily sideways channel to its upper boundary after a deviation formed at the channel's lower edge and then at the upper edge. The upper-edge deviation was deep, but if it truly was a deviation, Bitcoin could soon head toward $70,800. After that, the price would likely trade inside the flat again, and its prospects would remain uncertain.
Help arrived from an unexpected source. For weeks, we've warned traders that far more catalysts drive a crypto market decline than upside. Overnight, the market was hit by a major shock: a hack of Binance, the world's largest crypto exchange. According to various reports, hackers stole about $6 billion worth of tokens, and investors and traders withdrew roughly another $4 billion — for a total of about $10 billion lost from the exchange in just 10–12 hours. Capital outflows under such circumstances are unsurprising: if the world's largest exchange is hacked, investors will withdraw funds. We expect that process to continue today.
More worrying is the wider implication. If even the largest exchange can be hacked and investors' crypto stolen, what does that imply for private wallets? What will happen when sufficient quantum computing power appears? Artificial intelligence is advancing, and its capabilities grow every day. AI enthusiasts promise a prosperous future where AI does the work and humanity enjoys life; in practice, we are seeing how these technologies can be used — and how they can be used against crypto. Remember, stealing physical gold is extremely difficult or practically impossible; stealing a piece of software code is much easier. Today, the world received a stark reminder of which is safer and more resilient.
General Picture of BTC/USD on 1D
On the daily timeframe, the downward trend structure has broken, so "digital gold" has likely entered the process of forming a new bullish trend. The price worked off the bearish FVG from the previous trend, reacted to that pattern, and a correction began as expected. However, the September breakout beyond the $60,000–$82,500 sideways channel may still be a deviation which, combined with the reaction to the bearish FVG, could trigger a drop toward the lower boundary of the sideways channel. Another sell signal formed inside the last bearish FVG. In addition, a bearish order block has formed, also pointing south and potentially generating another sell signal.
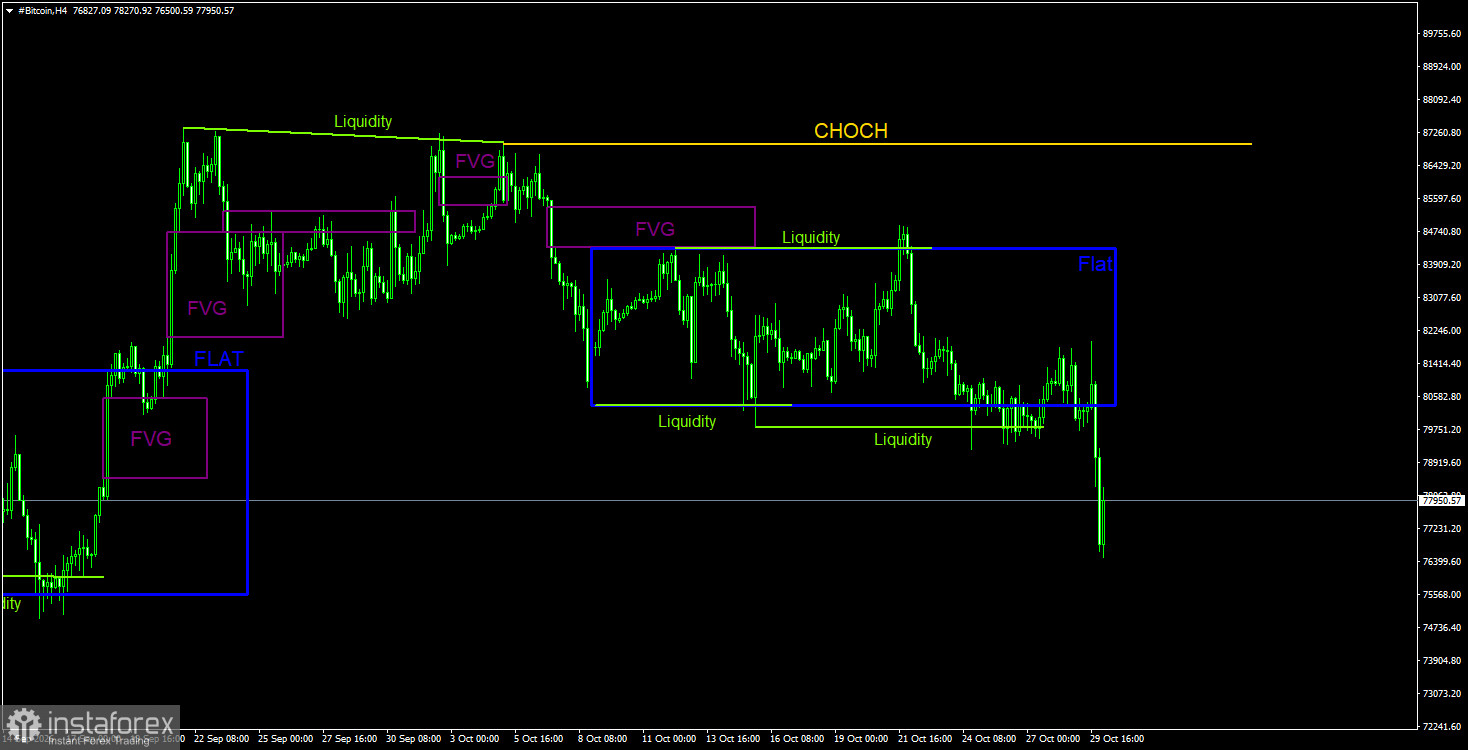
General Picture of BTC/USD on 4H
On the 4-hour timeframe, a downward structure continues to form. The CHOCH line is currently at the $87,000 level. On the daily TF, all necessary reversal signals to the downside were received, allowing traders to open short positions. Bitcoin's targets are best determined by the daily sideways channel, which we regard as still relevant. On the 4-hour TF, Bitcoin has finally left the sideways channel, as we anticipated. Thus, in the near term, traders can use local bearish patterns to open short positions.
Trading Recommendations for BTC/USD
Bitcoin shows signs of the start of a new bullish trend. As is typical, this trend began with a pump with no clear, specific reason. However, in the near term on the daily TF, Bitcoin may be in a decline because the price reacted to the last two bearish FVGs and formed a bearish order block. Also note that the breakout beyond the daily sideways channel may be a deviation — yes, a deep deviation, but still a deviation. If so, Bitcoin could head toward $70,800 and even maintain the downtrend that began last year. We believe short positions are most relevant in the near term.
Explanations for the illustrations:
CHOCH — Change of Character: a break in trend structure.
Liquidity — Liquidity: stop-losses and pending orders that market-makers use to accumulate positions.
FVG — Fair-Value Gap: a price-inefficiency zone. Price moves quickly through such areas, indicating one side is absent from the market. Subsequently, price often returns and reacts to these areas, continuing the main trend.
IFVG — Inverted Fair-Value Gap: after returning to such a zone, price does not react there but impulsively breaks through it and then tests it from the other side.
OB — Order Block: a candle where a market-maker opened a position with the intent to take liquidity and then establish a position in the opposite direction.